Exploring Monitorings
After creating your monitoring, it can be explored by hovering your mouse over the monitoring and clicking Show
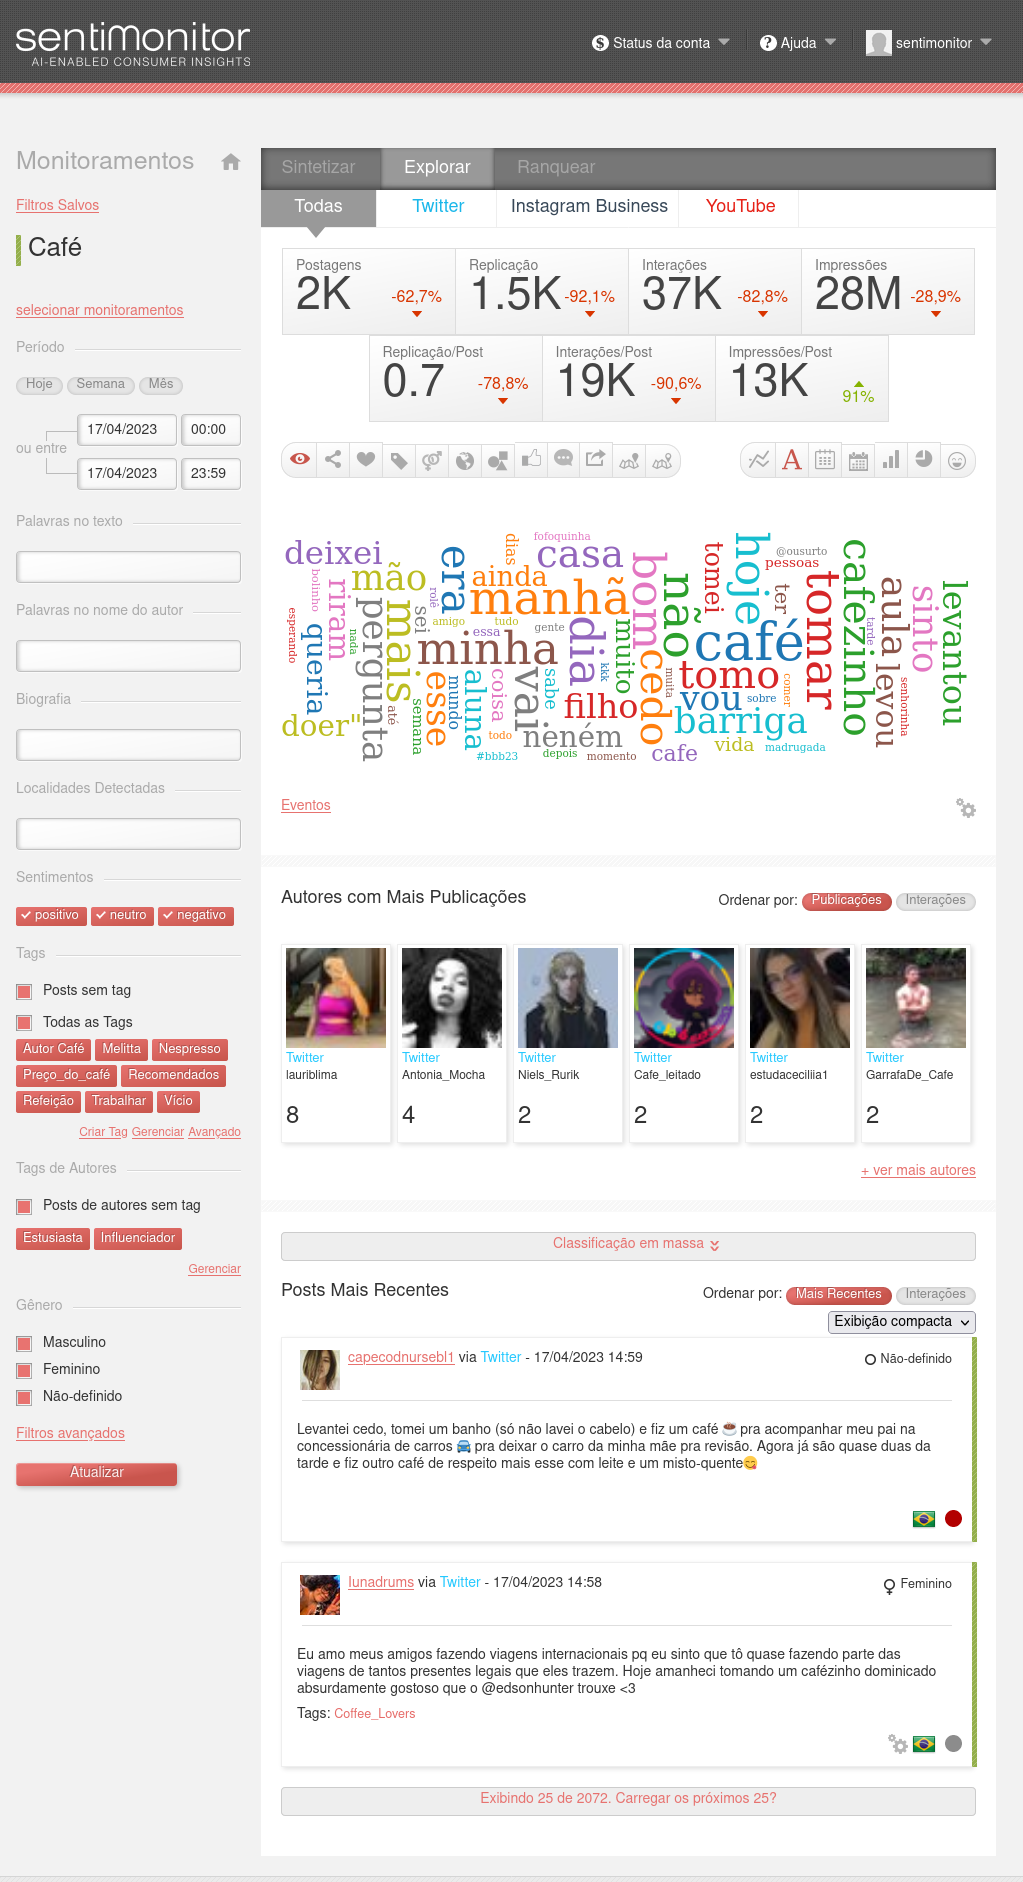
Upon clicking on the Monitoring, a new page will appear on screen. On this page, it is necessary to highlight some important points:
-
The filters are located in the column at the left of the screen. All the numbers, graphics and posts shown on the right side reflect the filters selected in this column;
-
On the right side of the screen, you can see the different summaries and tools to change the view of the posts selected by the filters;
-
The user can navigate between the Synthesize (which presents a summary of the information), explore (which allows the user to explore posts) and rank (which allows the user to analyse the authors of the posts collected);
-
By clicking on the reports button located at the bottom-right corner of the screen, it’s possible to export posts, authors, graphics and more to configure daily reports or the presentation mode.