Numeric Indicators
The indicators can be shown in a general format or for each social media. Up until now, Sentimonitor has made specialised indicators for Facebook, Twitter, Instagram and YouTube available. To select the indicators that you wish to see, select the corresponding social media underneath the Panorama tab.
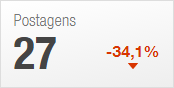
The indicators are made up of two figures: the main indicator, which summarises a certain piece of information in a single number, and its variation in relation to the period prior. For example, an indicator of Posts with the number 27 and -34.1% indicates that, for the filters selected, there were 27 posts, and this is 34.1% less posts than in the period before (which was 41 posts). Note that the period prior relates to a length of time equal to the current filters selected, but ends as soon as the current period began.
| Abbreviation | Multiplier | Example |
|---|---|---|
| K | 1.000 (one thousand) | 49K → 49.000 |
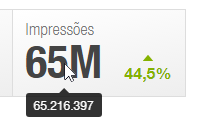
| M | 1.000.000 (one million) | 2.5M → 2.500.000 |
| B | 1.000.000.000 (one billion) | 21.4B → 21.400.000.000 |
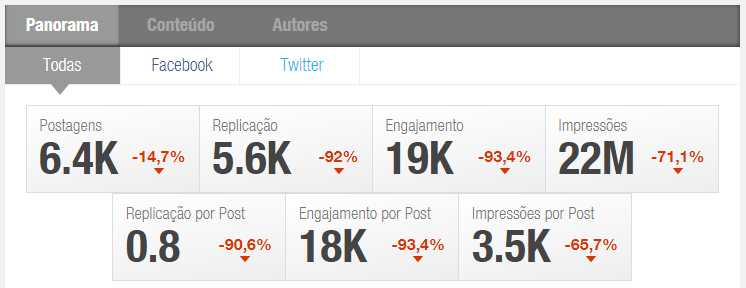
If you select the All tab, the following indicators will be shown:
-
Posts: indicates the total number of posts collected.
-
Replication: indicates the total number of times a posts were shared on all social medias selected. This indicator considers just the posts from Facebook and Twitter. Every share of a post on Facebook or retweet of a tweet on Twitter increases this indicator.
-
Replicação: indica o número total de Compartilhamento de Postagens em todas as redes selecionadas. Este indicador considera apenas postagens no Facebook e no Twitter. Cada Compartilhamento de uma Postagem no Facebook ou de um Tweet incrementa esse indicador.
-
Engagement: indicates the total number of times followers interacted with the posts collected. For Facebook, the number of likes, shares and comments on posts are counted for engagement; for Instagram, the number of likes and comments on a photo; on Twitter the number of likes and retweets; and for YouTube the number comments and likes on a video.
-
Impressions: this is the estimated number of times that users saw the posts selected (the reach). The number only considers posts from Twitter and Instagram. On Twitter, this number equates to the number of people who follow the user who posted the original tweet, plus the total number of followers of those who retweeted the tweet. On Instagram, this number equates to the number of people who follow the person who posted the photo.
-
Replication per Post: estimates the average number of shares and retweets per post. Therefore, like the Replication indicator, it only takes into account posts from Facebook and Twitter. It’s value is the same as the Replication figure divided by the total number of posts within that period.
-
Engagement per Post: estimates the average number of interactions with each post during the time period. This indicator considers posts from Facebook, Twitter, Instagram and YouTube. The calculation is done in two parts. Firstly, the engagement is calculated for each social media, taking into account the rules from the Engagement indicator. Next, the average is done by comparing the engagement from each social media with the number of posts per social media. The formula for this is:
Total Weighted Engagement = Facebook engagement × # Facebook posts + Instagram engagement × # Instagram posts + Twitter engagement × # Twitter posts + Youtube engagement × # Youtube posts Engagement per Post = Total Weighted Engagement / (# Facebook posts + # Instagram posts + # Twitter posts + # Youtube posts) -
Impressions per Post: This indicator tries to estimate the average number of times each post was viewed on social media (the average reach of each post). The number takes into account only the posts from Twitter and Instagram. It is calculated by dividing the Impressions indicator by the total number of posts on Instagram and Twitter.
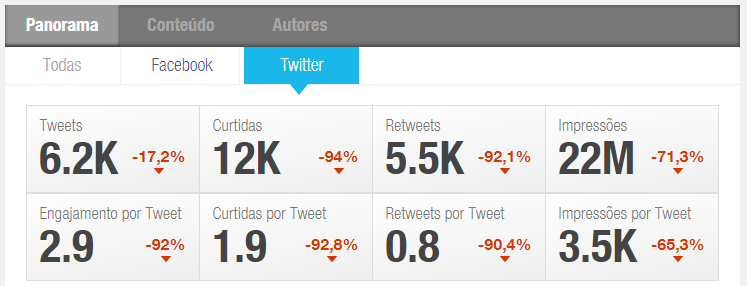
To see the indicators and statistics for individual social medias, click on the social media you want to see. On selecting Twitter, for example, the following indicators will be shown:
-
Tweets: shows the total number of tweets filtered.
-
Likes: shows the total number of likes on the tweets filtered.
-
Retweets: shows the total number of times the tweets filtered were retweeted.
-
Impressions: is the estimated number of users who saw the tweets (reach). This calculation is done by adding the original author’s number of followers and the followers of each of each user who retweeted.
-
Engagement per Tweet: indicates the average number of interactions with each tweet. It is the sum of the total number of likes and the total number of retweets, divided by the total number of tweets.
-
Likes per Tweet: indicates the average number of likes on each tweet. Calculated by dividing the total number of likes by the total number of tweets.
-
Retweets per Tweet: indicates the average number of retweets on each tweet. Calculated by total number of retweets divided by the total number of tweets.
-
Impressions per Tweet: indicates the average number of impressions per tweet. Calculated by dividing the total number of impressions by the total number of tweets.
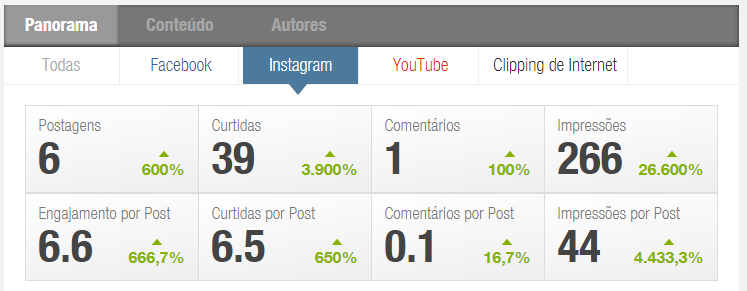
On selecting Instagram, the following indicators will be available:
-
Posts: the total number of photos collected on Instagram.
-
Likes: total number of likes on the photos collected from Instagram.
-
Comments: total number of comments on the photos collected from Instagram.
-
Impressions: the estimated total number of times photos collected were viewed on Instagram during the time period. Equates to the total number of followers of all the authors of the photos.
-
Engagement per Post: indicates the average number of interactions with each photo. Calculated by the total number of likes on the photos divided by the total number of photos collected.
-
Likes per Post: indicates the average number of likes on each photo. Calculated by the total number of likes divided by the total number of photos.
-
Comments per Post: indicates the average number of comments on each photo. Calculated by dividing the total number of comments by the total number of photos.
-
Impressions per Post: indicates the average number of impressions on each photo. Calculated by dividing the total number of impressions by the total number of photos.
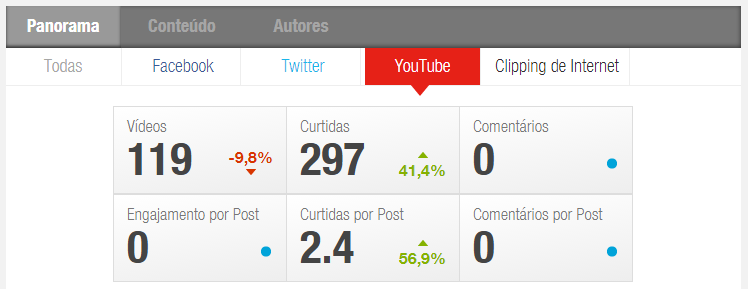
On selecting YouTube, you will be able to see the following indicators:
-
Vídeos: number of videos collected from Youtube.
-
Likes: total number of likes on the videos collected.
-
Comments: total number of comments on the videos collected.
-
Engagement per Post: indicates the average number of interactions with each video. Calculated by dividing the total number of likes and comments by the total number of videos.
-
Likes per Post: indicates the average number of likes on each video. Calculated by dividing the total number of likes by the total number of videos collected.
-
Comments per Post: indicates the average number of comments on each video. Calculated by dividing the total number of comments by the total number of videos collected.
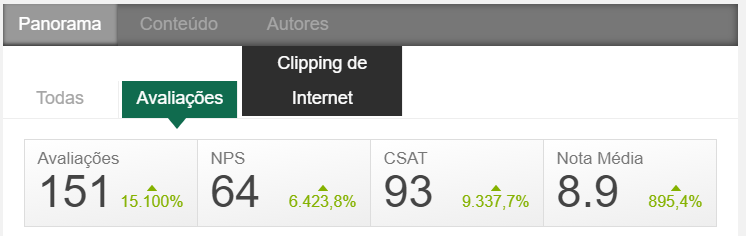
On selecting Reviews, you will be able to see the following indicators:
-
Reviews: is the total number of filtered Reviews.
-
NPS: is the NPS (Net Promoter Score) indicator computed from the filtered Reviews. The formula for this indicator is:
NPS = 100 x (Number of promoters — Number of detractors) / (Number of Reviews) -
CSAT: is the CSAT (Customer Satisfaction Score) indicator computed from the filtered Reviews. The formula for this indicator is:
CSAT = 100 x (Number of satisfied Reviews) / (Number of Reviews)In the formula above, satisfied Reviews are those who responded with a score of 7 or higher.
-
Average Score: arithmetic mean of the scores of the filtered Reviews.